Dashboard
The dashboard gives information about the tenant’s current quotas usage, and day-by-day usage.
Usage
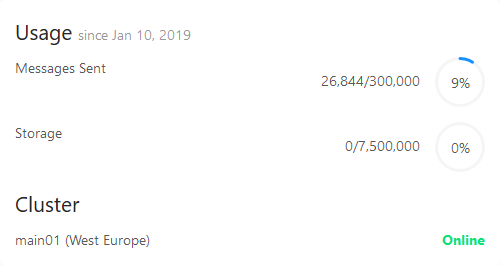
The Usage panel gives a quick overview of the quotas usage for the current period. If you see that you’re getting close to the limits, upgrade your plan to avoid loosing data. Plans may be adjusted at any time with no additional cost.

The panel also shows the current state of the cluster on which the tenant’s data is handled.
Day by day usage
The messages graph allows to see how many messages were sent each day on a given period of time, up to one year.
